![]()
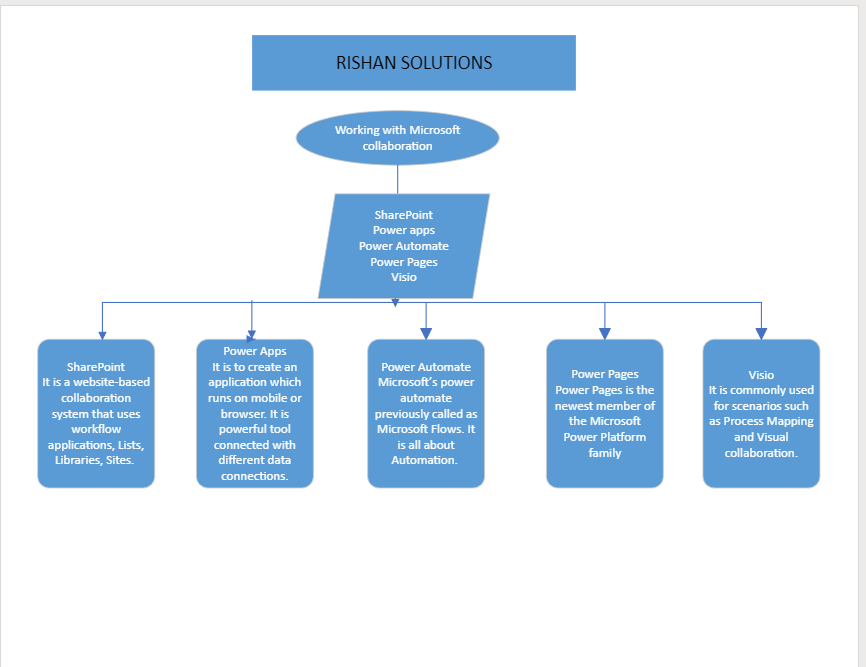
What is Visio:
Visio is a Microsoft Windows based on diagramming software that includes templates and symbols allowing users to create flowcharts, organizational charts, floor plans, network diagrams, mind maps, infographics and more. Visio is part of the Microsoft Office software suite, although it is sold as a stand-alone program.
Visio was first released by the Visio Corporation (known then as the Shapeware Corp.) in 1992 and acquired by Microsoft in 2000. Visio is primarily sold as downloadable software, but released an online version in 2017. There are no native Mac OS versions of Visio.
Visio Diagram Types-
There are several different types of diagrams you can make using Microsoft Visio. Below are some of the more popular uses for Visio.
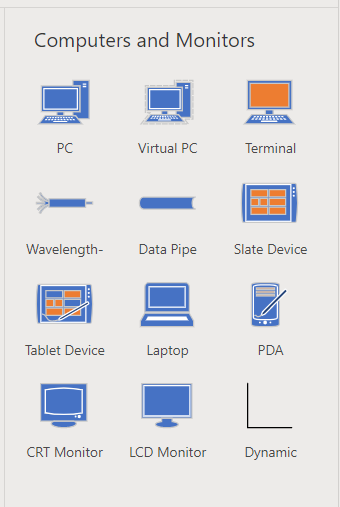
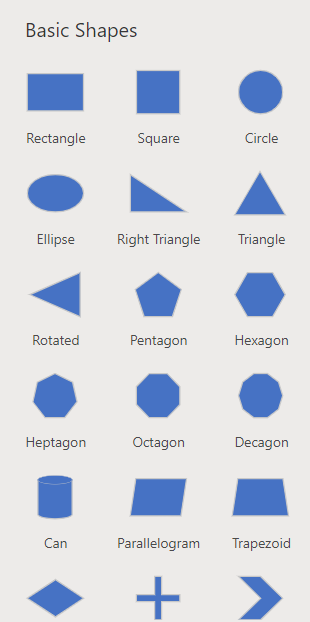
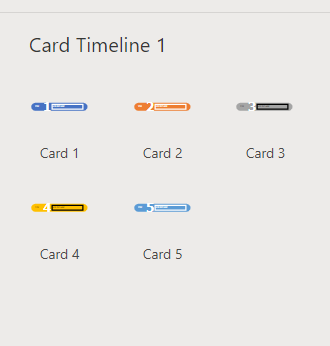
- On Left Navigation Select and add more Shapes to create flow charts, graphs, diagrams.
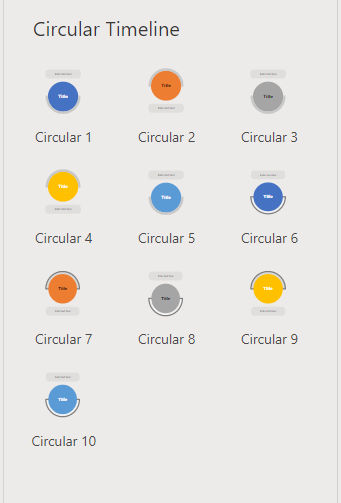
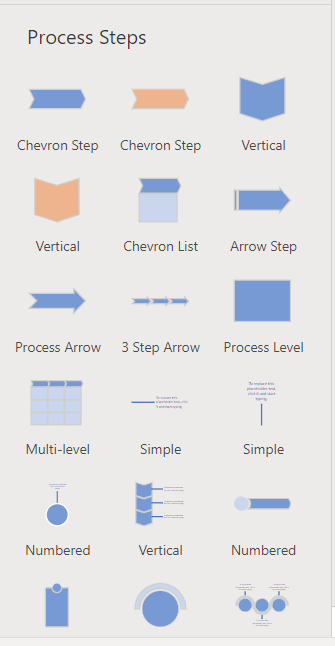
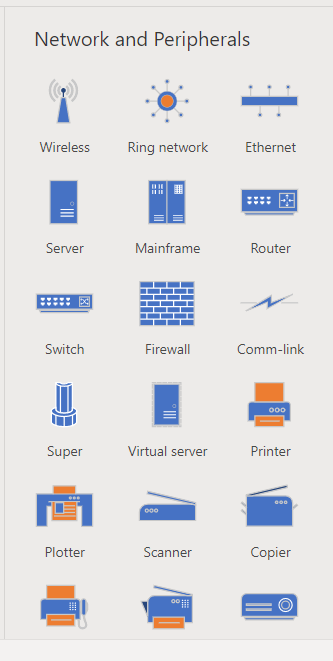
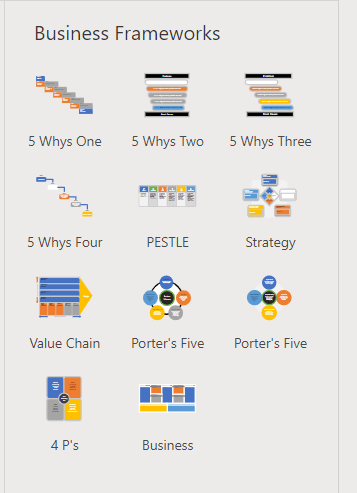
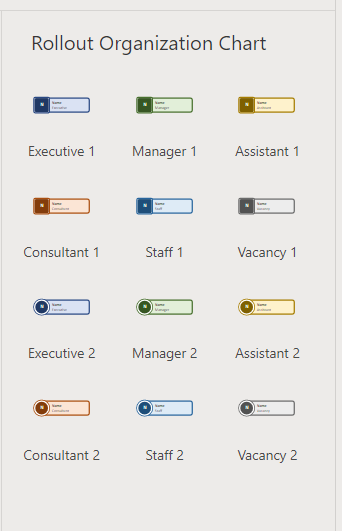
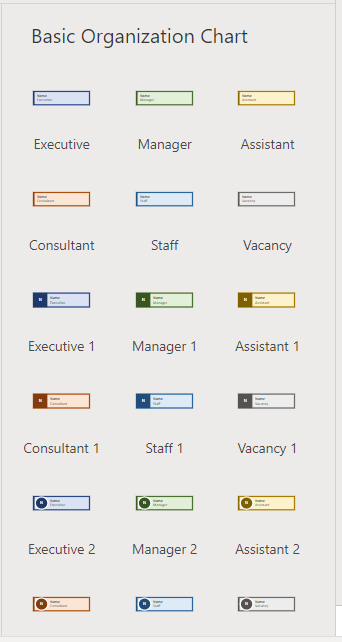
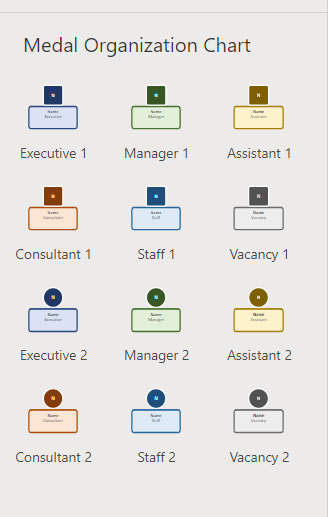
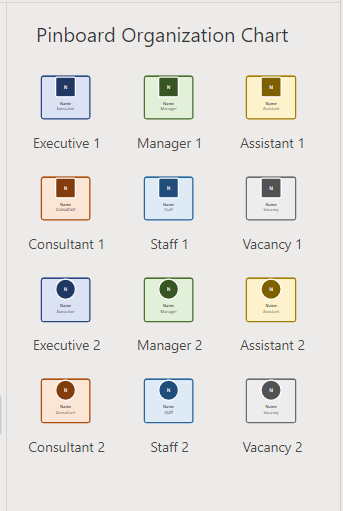
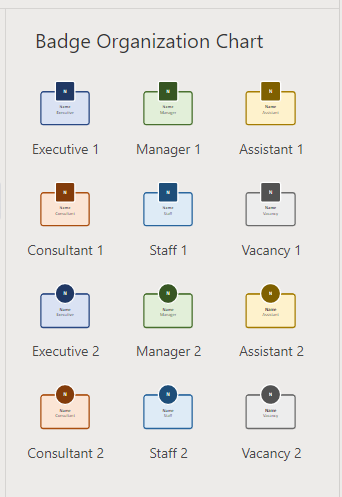
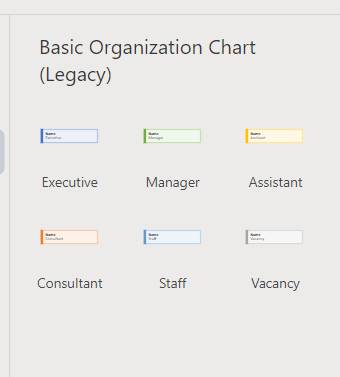
Basic shapes, Blocks,Arrow shapes, Blocks raised, Callouts, Banners, Symbols, Graphs and Math shapes, Process steps, Matrix diagram shapes,Cycle diagram shapes, Pyramid shapes, Venn diagram shapes, Basic organization chart(legacy),Basic organization charts, Medal organization charts,Pinboard organization chart, Badge organization chart, Rollout organization chart, Business frameworks,Basic flowchart shapes, Network and Peripherals,Computer and Monitors, Button Timeline,Ring Timeline,Triangle Timeline, Parallel Timeline,Tree Timeline, Smart Timeline,Circular Timeline, Card Timeline 2,Card Timeline 1.
Flowcharts:
Flowcharts show a visual sequence of steps and decisions for a process, generally using shapes to show the steps and arrows to show the progression from one step to another. Flowchart is a generic term, and can also include process flows, process maps, work flows and flow diagrams.
Organizational Charts:
Organizational charts, or org charts, show the reporting relationships and hierarchies within an organization. They can show who reports to who, as well as the overall hierarchy from top to bottom to help with planning and management. Organizational charts are also known as hierarchy charts, structure charts and organograms.
Mind Maps:
Mind maps are diagrams that show the connection between ideas by grouping and connecting related ideas to the overall topic(s) at hand. Mind maps make for effective planning and brainstorming tools. Mind maps are also known as concept maps.
Charts & Graphs:
A staple of Excel, but also included in Visio, charts and graphs are seen in almost every business presentation. They are used to represent data visually in a way that makes the information being presented easier to understand. Common examples include bar charts, line charts and pie charts.
Gantt Charts:
A common diagram in project management and planning is a Gantt chart. Gantt charts show individual tasks in a project, their start and end dates, the people assigned to the tasks as well as other information relevant to the project. While Microsoft also develops Project, a dedicated project planning software, Visio still includes rudimentary project planning templates as well.
Network Diagrams:
Network diagrams use symbols and lines to show the structure, nodes and connections for a location’s computer network. Network diagrams are useful for understanding which nodes are a part of which network, but can also be useful in understanding how computer data flows through an organization.