
![]()
Gallery control:-
Power Apps Gallery is a type of control that can display a set of records from a data source. In the gallery, each record holds multiple types of data. Also, it can contain other controls.
As the definition above states, it can have other controls inside. It can be used to list, edit, and create new records.
Power apps gallery types :-
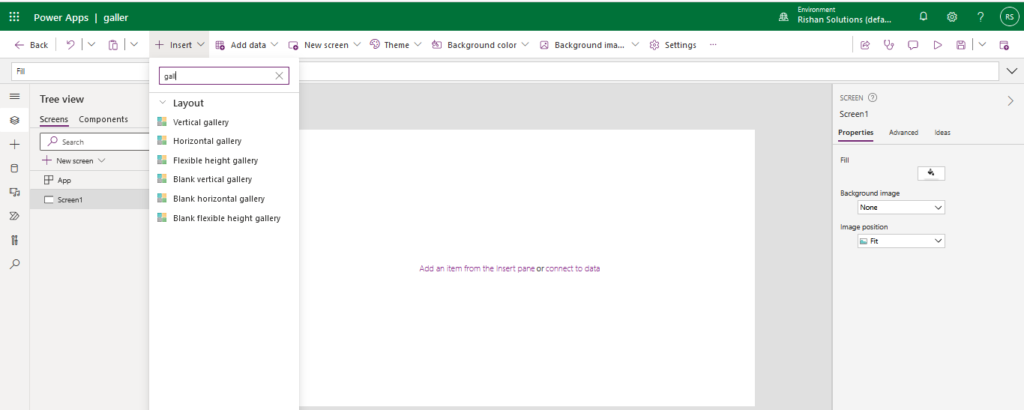
- There are total six different types of gallery control in Power Apps. Such as: As shown below
- Vertical
- Horizontal
- Flexible height
- Blank vertical
- Blank horizontal
- Blank flexible height
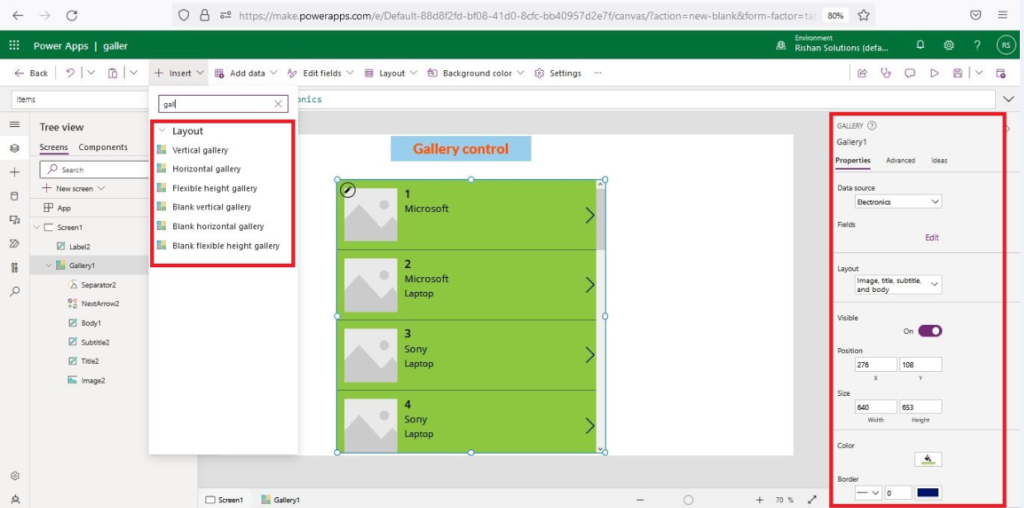
Here i have connected share point(Electronics list) to power apps as data source.Inserted an Gallery to Display the data .
To insert any kind of gallery in Power Apps, go to Insert tab -> Click on Gallery -> then you can choose your desired gallery from the gallery section as shown below.
Data tables :-
Power Apps Data Table is a type of control that helps to display a bunch of data in a tabular format. The data table contains a Header for each field that the control displays. The Data table control contains the Selected property that directs to the selected row. Also, you can link the data table control to other controls.
Data in a Data table control is read-only. Customize the styling of individual columns is not available. A single row is always selected in a Data table control. Adding a Data table control in a form control is not available. Link a Data table control to a connected or local data source.Changing the height of all rows is not available.
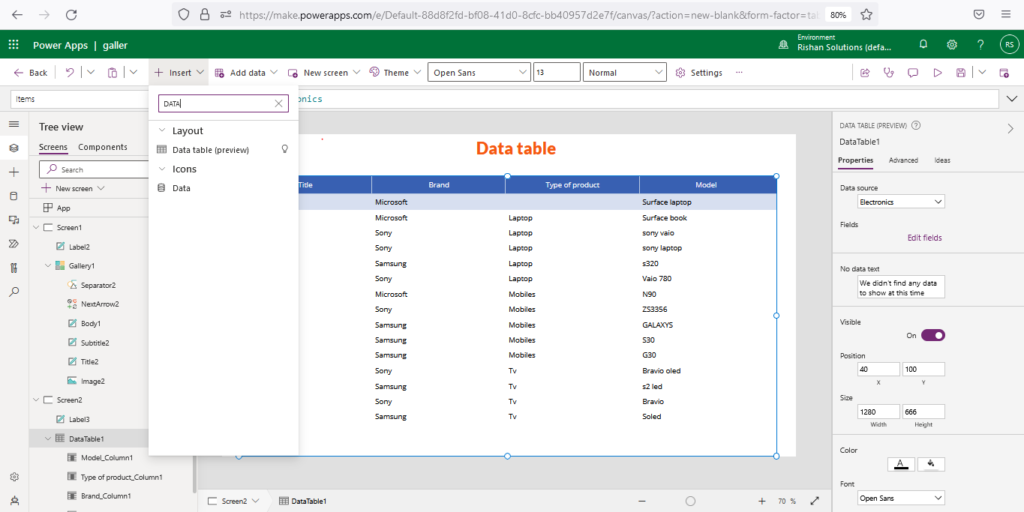
To insert a data table in Power Apps, go to Insert tab -> Click on Data table -> then you can choose your desired one as shown below.
Here i am using share point list i.e electronics as data source.
Difference between Gallery and Data table :-
| Gallery | Data table |
| 1. Header auto populated 2. Complete Design auto populated 3. Only used to display the data 4. Cannot add additional columns ( fields) which are not a part of data source . | 1. Manually need to create header 2. Manually need to design 3. Along with displaying data we can apply action on it. 4. we can add additional columns even though they are not part of data source. |
https://youtu.be/SGWbgCBFqdM?list=PLdJ-6ssiefOANBnrdDKexSb_jBk88PFeh