


Comprehensive Guide to SQL Server Replication Monitoring Tools
SQL Server replication is a critical feature that enables data distribution across multiple databases, ensuring high availability and scalability. However, managing and monitoring replication can be complex due to its distributed nature. Effective monitoring tools are essential for ensuring the health and performance of replication systems.
1. Native SQL Server Monitoring Tools
1.1 Replication Monitor
Replication Monitor is a built-in tool in SQL Server Management Studio (SSMS) that provides a graphical interface to monitor the status and performance of replication. It offers real-time information about the health of publications, subscriptions, and replication agents.
Key Features:
- Agent Status: Displays the current status of replication agents (Log Reader, Distribution, Merge, etc.).
- Latency Monitoring: Monitors the time delay between data changes at the publisher and their reflection at the subscriber.
- Performance Metrics: Provides information on throughput and performance of replication agents.
- Error Detection: Identifies and alerts on replication errors and conflicts.
Usage:
- Open SSMS and connect to the server instance.
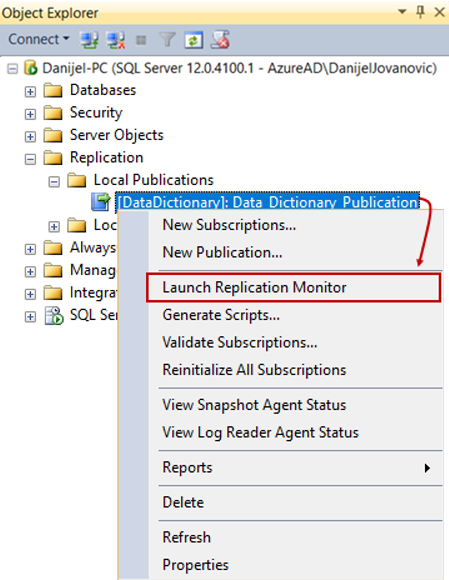
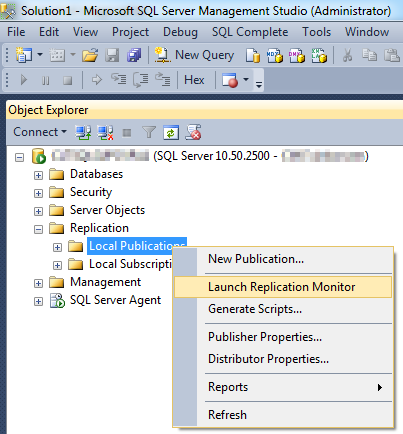
- Navigate to the Replication folder in Object Explorer.
- Right-click on Local Publications or Local Subscriptions and select Launch Replication Monitor.
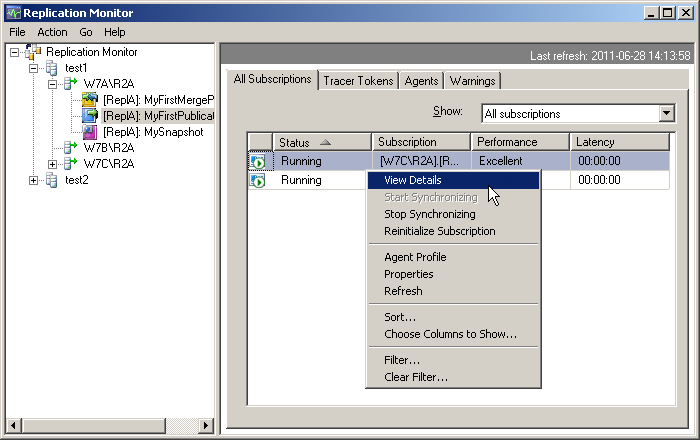
- In Replication Monitor, select the publication or subscription to monitor.
- Use the tabs to view agent status, latency, and performance metrics.(Anthology Help)
1.2 Performance Monitor (PerfMon)
Performance Monitor is a Windows tool that allows monitoring of various system metrics, including those related to SQL Server replication. It provides detailed insights into system performance and can help identify bottlenecks affecting replication.
Key Counters for Replication:
- SQLServer:Replication Agents: Monitors the performance of replication agents.
- SQLServer:Replication Dist Agents: Tracks the performance of distribution agents.
- SQLServer:Replication Logreader: Monitors the performance of log reader agents.
- SQLServer:Replication Merge Agents: Tracks the performance of merge agents.
Usage:
- Open Performance Monitor (type
perfmonin the Run dialog). - Click on the green plus icon to add counters.
- In the Add Counters dialog, select SQLServer from the list of available objects.
- Choose the desired counters and click Add.
- Monitor the selected counters to assess replication performance.(Anthology Help)
2. Extended Events for Advanced Monitoring
Extended Events (XEvents) provide a lightweight and flexible way to monitor SQL Server events, including those related to replication. They offer more granular control and less overhead compared to traditional SQL Trace.(Port 1433)
Example: Monitoring Distribution Database Activity
To monitor activity in the distribution database, you can create an extended event session:(Port 1433)
CREATE EVENT SESSION [Distribution Activity] ON SERVER
ADD EVENT sqlserver.rpc_completed(
    ACTION(sqlserver.database_name, sqlserver.sql_text, sqlserver.username)
    WHERE ([sqlserver].[database_name] = N'distribution'))
ADD TARGET package0.event_file(SET filename = N'DistributionActivity.xel')
WITH (MAX_MEMORY = 4096 KB, EVENT_RETENTION_MODE = ALLOW_SINGLE_EVENT_LOSS, MAX_DISPATCH_LATENCY = 30 SECONDS);
GO
Usage:
- Execute the above script in SSMS to create the event session.
- Use the following command to start the session:
ALTER EVENT SESSION [Distribution Activity] ON SERVER STATE = START;
GO
- To view the captured events:(MSSQLTips)
SELECT * FROM sys.fn_xe_file_target_read_file('DistributionActivity*.xel', NULL, NULL, NULL);
GO
This setup captures remote procedure calls (RPCs) executed in the distribution database, which can help identify performance issues or bottlenecks. (Port 1433)
3. Third-Party Monitoring Tools
3.1 SymmetricDS
SymmetricDS is an open-source database synchronization and replication tool that supports multi-master replication and is designed for high availability and disaster recovery scenarios. It provides monitoring capabilities to track the status and performance of replication.(Wikipedia)
Key Features:
- Multi-Master Replication: Supports bidirectional data synchronization across multiple nodes.
- Conflict Resolution: Provides mechanisms to handle data conflicts.
- Monitoring Dashboard: Offers a web-based interface to monitor replication status and performance.
Usage:
- Install and configure SymmetricDS on all participating nodes.
- Access the monitoring dashboard through a web browser.
- Use the dashboard to view replication status, performance metrics, and logs.
4. PowerShell and Replication Management Objects (RMO)
PowerShell, in conjunction with Replication Management Objects (RMO), provides a powerful scripting environment to monitor and manage SQL Server replication. This combination allows for automation and custom monitoring solutions.
Example: Monitoring Replication Latency
Using PowerShell and RMO, you can monitor replication latency by querying the status of replication agents and calculating the time difference between data changes at the publisher and their reflection at the subscriber. (MSSQLTips)
Usage:
- Install the SQL Server PowerShell module and load the RMO assembly.
- Use PowerShell cmdlets to connect to the SQL Server instance and retrieve replication agent status.
Certainly! Let’s continue with more detailed information on SQL Server Replication Monitoring Tools.
4. PowerShell and Replication Management Objects (RMO) (Continued)
PowerShell and Replication Management Objects (RMO) are incredibly useful for administrators who need to automate the monitoring and troubleshooting of SQL Server replication. Through the integration of RMO with PowerShell scripts, you can build custom solutions for replication health monitoring, reporting, and automation. Below are some additional insights and usage examples.
Example: Monitoring Replication Agent Status with PowerShell
To retrieve the status of replication agents, you can utilize PowerShell scripts that connect to the SQL Server instance and use the RMO to fetch detailed information about the replication status. Here’s an example script that fetches and displays the status of replication agents:
# Load SQL Server Replication Management Objects (RMO)
[System.Reflection.Assembly]::LoadWithPartialName("Microsoft.SqlServer.Replication")

# Create a connection to the distribution server
$serverName = "YourSQLServerName"
$publisherName = "YourPublisherName"
$distributor = "YourDistributorName"

# Create Replication Object
$replicationServer = New-Object Microsoft.SqlServer.Replication.Server
$replicationServer.ConnectionContext.ServerName = $distributor

# Connect to the distributor
$replicationServer.Connect()

# Get the distribution agent
$distributionAgent = $replicationServer.TransPub.GetDistributionAgent("YourPublisherDB")

# Display agent status
$distributionAgentStatus = $distributionAgent.Status
Write-Host "Replication Agent Status: $distributionAgentStatus"
How It Works:
- The script loads the RMO assembly to interact with SQL Server replication features.
- It then connects to the distribution server, where the replication status is queried.
- The script fetches the status of the distribution agent and displays it.
Benefits:
- PowerShell allows you to automate routine replication checks.
- It provides flexibility to customize monitoring scripts based on your environment.
- This script can be scheduled as a task to run periodically, ensuring continuous monitoring.
5. SQL Server Agent Alerts and Notifications
SQL Server Agent is another critical tool for monitoring replication. By setting up alerts and notifications through SQL Server Agent, you can automatically be informed of replication issues such as agent failures, high latency, or conflict resolution problems. The agent alerts can be tied to SQL Server’s event notifications, allowing for immediate corrective actions.
Key Steps for Setting Up Alerts:
- Create a New Alert:
- In SQL Server Management Studio (SSMS), expand SQL Server Agent in Object Explorer.
- Right-click on Alerts and choose New Alert.
- Define the Alert:
- Specify a name for the alert and the type of event to be monitored (such as replication agent failure or high latency).
- Under Type, select SQL Server Event or Performance Condition depending on your needs.
- Set the Notification:
- Under the Response tab, define the actions that should occur when the alert is triggered, such as sending an email or executing a job.
- You can integrate it with SQL Server Database Mail for email notifications.
Example: Setting up an Alert for Replication Agent Failures
- In SQL Server Agent, create an alert that listens for specific error codes related to replication agent failures.
- This could be an error code like 14151, which indicates that a replication agent has failed.
- When this alert is triggered, SQL Server Agent can notify administrators via email or text message.
This monitoring method can greatly reduce the time spent investigating replication issues manually, ensuring that replication health is continuously watched.
6. Third-Party Monitoring Tools for Replication
While SQL Server provides excellent built-in tools for monitoring replication, many organizations choose to leverage third-party solutions for enhanced monitoring, reporting, and alerting. These tools can often integrate seamlessly with SQL Server, providing more in-depth insights and additional features.
6.1 Redgate SQL Monitor
Redgate SQL Monitor is a powerful third-party tool designed for SQL Server monitoring, which includes comprehensive support for monitoring SQL Server replication. This tool offers advanced metrics, historical data retention, and proactive alerting.
Key Features:
- Comprehensive Monitoring: Monitors replication health, latency, and agent status.
- Real-time Alerts: Notifies you of replication issues in real-time via email, SMS, or webhooks.
- Historical Data: Retains historical performance data, allowing you to analyze trends and track replication performance over time.
Usage:
- Install Redgate SQL Monitor and configure it to connect to your SQL Server instance.
- Set up monitoring profiles for replication health and performance.
- Use the web-based dashboard to monitor replication status, agent activity, and replication latency.
6.2 Idera SQL Diagnostic Manager
Idera SQL Diagnostic Manager is another third-party tool offering comprehensive replication monitoring. It helps track SQL Server replication performance and provides in-depth diagnostics to identify performance bottlenecks or issues with replication agents.
Key Features:
- SQL Server Replication Monitoring: Offers real-time monitoring for SQL Server replication.
- SQL Query Performance Metrics: Monitors and alerts on SQL query performance, which can impact replication speed and efficiency.
- Trend Analysis: Helps analyze replication performance trends over time and forecast potential issues.
Usage:
- Install Idera SQL Diagnostic Manager on your SQL Server instance.
- Configure replication monitoring by adding your replication databases and agents.
- Review the monitoring dashboard for replication alerts, performance statistics, and agent status.
7. Custom Dashboards and Reports
For advanced users who require tailored monitoring solutions, custom dashboards and reports can be created using tools like SQL Server Reporting Services (SSRS), Power BI, or even custom applications built with SQL Server data.
Example: Creating a Replication Health Dashboard with Power BI
Step 1: Query Replication Data
- Use SQL queries to pull replication agent status and performance metrics from system tables like
MSreplication_statusandMSdistribution_status.
Step 2: Build a Power BI Report
- Import the replication data into Power BI.
- Create a report with tables, charts, and visual indicators of replication health (e.g., agent status, latency, conflicts).
Step 3: Share and Monitor
- Publish the report to the Power BI service for centralized monitoring.
- Set up email alerts to notify you when replication performance thresholds are exceeded.
This solution provides full flexibility to create exactly what you need and deliver tailored insights to various stakeholders in your organization.
8. Best Practices for SQL Server Replication Monitoring
To ensure effective and efficient monitoring of SQL Server replication, it is essential to follow best practices:
- Implement Automated Monitoring: Leverage tools like SQL Server Replication Monitor, Performance Monitor, and PowerShell scripts to automate the monitoring of replication agents and performance.
- Monitor Latency Regularly: Track latency between publishers and subscribers to identify any potential delays in replication.
- Set Alerts and Notifications: Establish alerts for key events such as replication agent failures, latency thresholds, or conflict detection.
- Review Replication Logs: Regularly review the replication logs and error tables (
MSrepl_errors) to identify issues early. - Use Historical Data: Leverage tools like Idera SQL Diagnostic Manager or Redgate SQL Monitor for historical data analysis, which helps spot performance degradation trends.
- Address Issues Proactively: Take corrective actions before replication issues affect business operations, using performance tuning, system resource allocation, or reinitializing subscriptions.
Effective monitoring of SQL Server replication is vital for maintaining data consistency and availability across distributed systems. SQL Server provides a set of native tools like Replication Monitor and Performance Monitor, while also allowing for integration with third-party solutions like Redgate SQL Monitor and Idera SQL Diagnostic Manager. Additionally, PowerShell and custom monitoring solutions provide more flexibility for advanced users.
By following best practices, automating monitoring, and leveraging the right tools, you can ensure that your SQL Server replication environment remains healthy, performant, and reliable.