


Certainly! Designing paginated reports in SQL Server Reporting Services (SSRS) is a comprehensive process that involves multiple steps, from initial setup to advanced customization. Below is a detailed guide that covers each aspect of SSRS paginated report design, ensuring you have a thorough understanding of the process.
1. Introduction to SSRS Paginated Reports
What Are Paginated Reports?
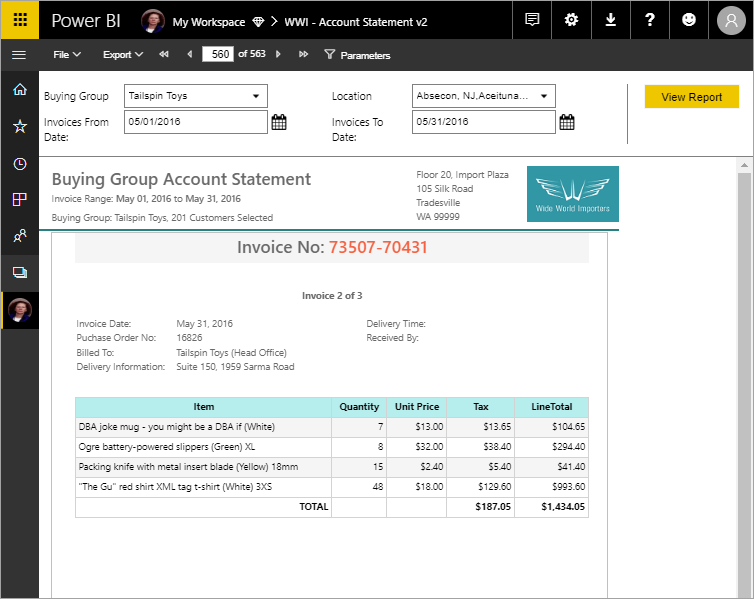
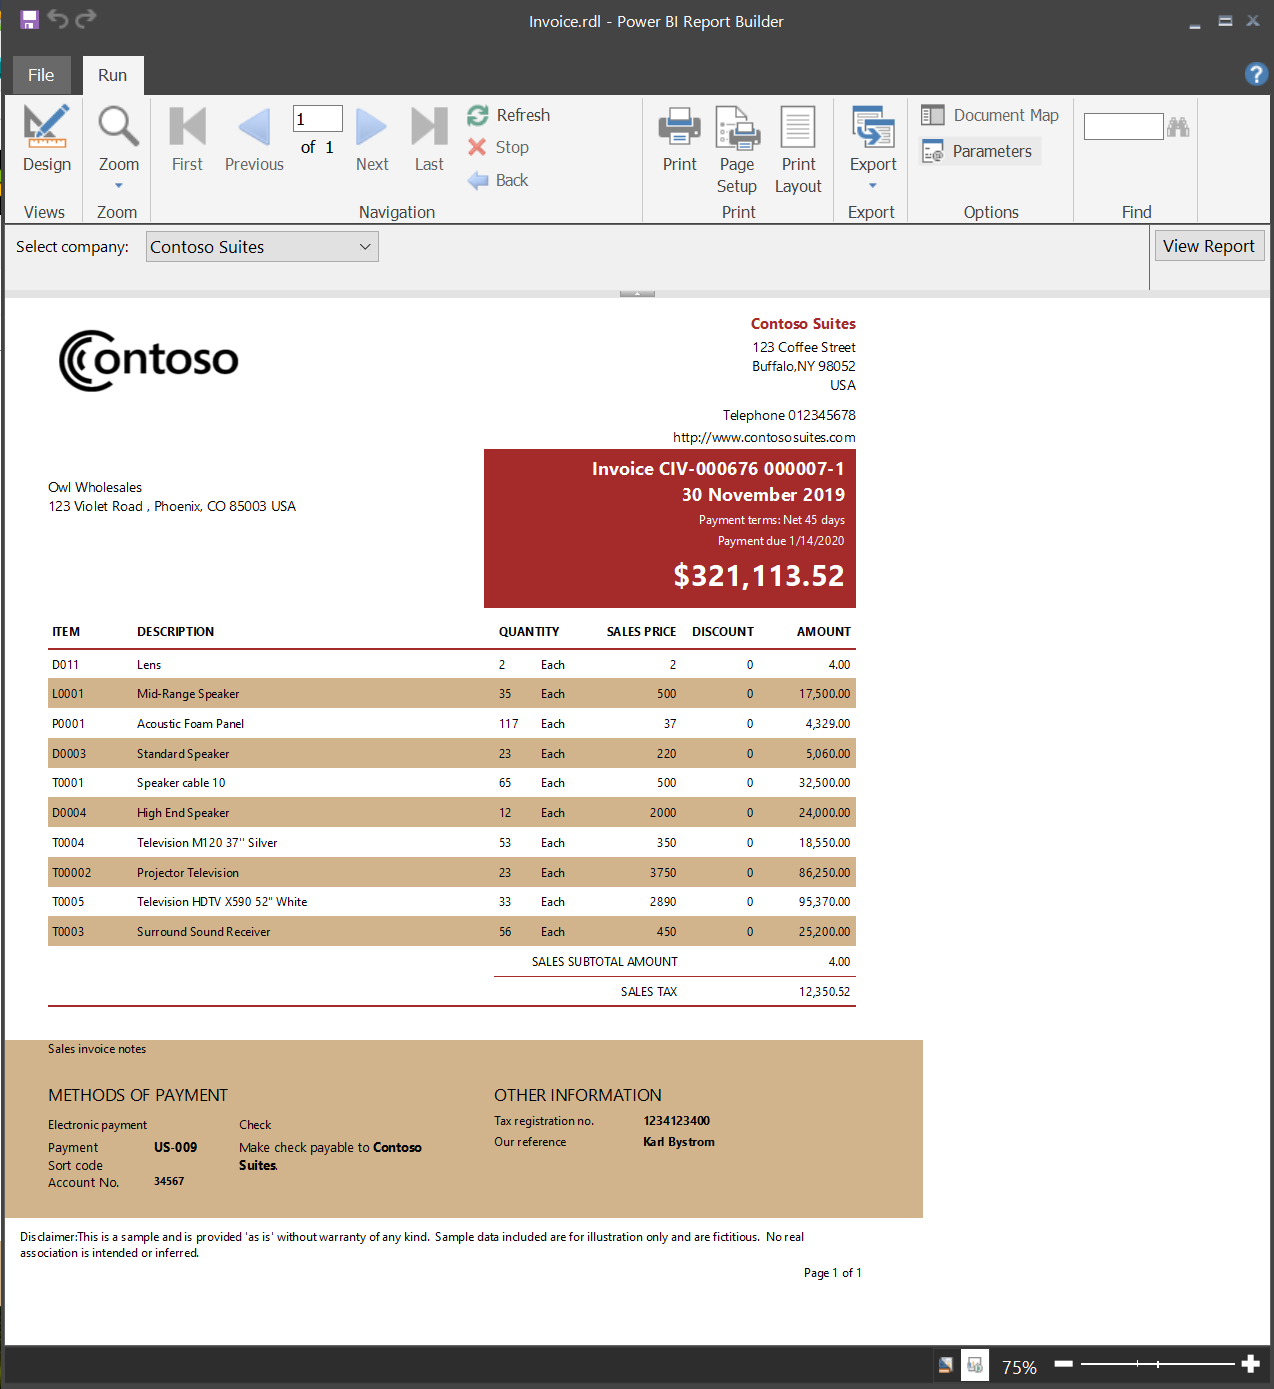
Paginated reports, often referred to as “pixel-perfect” reports, are designed to be printed or shared. They are ideal for scenarios where precise control over layout and formatting is required, such as invoices, financial statements, and operational reports.
Key Features
- Fixed Layout: Ensures consistent formatting across different devices and platforms.
- Multiple Rendering Formats: Supports various formats like PDF, Excel, Word, and HTML.
- Advanced Grouping and Sorting: Allows complex data organization and presentation.
- Interactive Features: Includes drill-through, drill-down, and parameterized reports.
2. Setting Up the Development Environment
Installing SQL Server Data Tools (SSDT)
To develop SSRS reports, you need to install SQL Server Data Tools (SSDT), which integrates with Visual Studio.
- Download SSDT: Obtain the latest version of SSDT compatible with your SQL Server version.
- Install SSDT: Run the installer and select the “SQL Server Data Tools” feature during installation.
- Launch Visual Studio: After installation, open Visual Studio and ensure SSDT is available under the “Business Intelligence” templates.
Connecting to a Data Source
- Open SSDT: Start Visual Studio and create a new SSRS project.
- Add Data Source: Right-click on the “Shared Data Sources” folder and select “Add New Data Source.”
- Configure Connection: Provide the necessary connection details, such as server name, authentication method, and database name.
- Test Connection: Click “Test Connection” to ensure successful connectivity.
3. Designing the Report Layout
Creating a New Report
- Add New Report: Right-click on the “Reports” folder in your SSRS project and select “Add New Report.”
- Report Wizard: Choose the “Report Wizard” option to guide you through the initial setup.
Selecting a Data Source
- Choose Data Source: Select the data source you configured earlier.
- Query Type: Choose between “Text” (for custom SQL queries) or “Stored Procedure” (for predefined procedures).
- Design Query: If using a text query, write your SQL query to retrieve the desired data.
Defining Dataset
- Create Dataset: Define a new dataset based on your query.
- Fields Selection: Choose the fields you want to include in the report.
- Preview Data: Use the “Run” button to preview the data returned by your query.
4. Adding Data Regions
Tables
- Insert Table: Drag a table from the toolbox onto the report design surface.
- Assign Dataset: Right-click the table and assign the dataset you created.
- Bind Fields: Drag fields from the dataset to the table columns.
Matrices
- Insert Matrix: Drag a matrix from the toolbox onto the report.
- Define Rows and Columns: Assign dataset fields to rows and columns.
- Add Data: Place data fields in the data area of the matrix.
Lists
- Insert List: Drag a list from the toolbox onto the report.
- Bind Dataset: Assign the dataset to the list.
- Design Layout: Place fields and controls within the list to design the layout.
5. Implementing Grouping and Sorting
Grouping
- Add Group: Right-click on the data region (table, matrix, or list) and select “Add Group.”
- Group By Field: Choose the field by which to group the data.
- Group Header/Footer: Optionally, add headers or footers for the group.
Sorting
- Sort Data: Right-click on the data region and select “Properties.”
- Sorting Tab: Go to the “Sorting” tab and add sorting expressions.
- Define Sort Order: Specify ascending or descending order for each field.
6. Configuring Pagination
Page Size and Layout
- Report Properties: Right-click on the report design surface and select “Report Properties.”
- Page Setup: Define the page size, orientation (portrait or landscape), and margins.
Page Breaks
- Insert Page Break: Right-click on a group or data region and select “Group Properties.”
- Page Breaks Tab: Under the “Page Breaks” tab, choose to insert a page break before or after the group.
Interactive Rendering
- Interactive Size: In the “Report Properties,” set the interactive height and width to control the on-screen rendering size.
- Considerations: Remember that interactive rendering does not respect physical page breaks.
7. Adding Parameters
Creating Parameters
- Add Parameter: Right-click on the “Parameters” folder and select “Add New Parameter.”
- Define Properties: Set properties such as name, data type, prompt, and available values.
Using Parameters in Queries
- Modify Query: Incorporate the parameter into your dataset query using syntax like
@ParameterName. - Set Default Values: Define default values for the parameters to guide users.
Displaying Parameter Values
- Add Textbox: Drag a textbox onto the report header or footer.
- Expression: Use an expression like
="Parameter: " & Parameters!ParameterName.Valueto display the parameter value.
8. Enhancing Report Interactivity
Drillthrough Reports
- Define Drillthrough: Right-click on a report item (e.g., a textbox) and select “Action.”
- Set Target Report: Choose the target report and pass parameters as needed.
Drilldown Toggles
- Add Toggle: Right-click on a data region and select “Row Visibility.”
- Set Visibility: Define the toggle item and visibility expression to control drilldown behavior.
Interactive Sorting
- Enable Sorting: Right-click on a column header and select “Text Box Properties.”
- InteractiveSort: Under the “Interactive Sort” tab, enable sorting and specify the sort expression.
9. Formatting and Styling
Fonts and Colors
- Set Fonts: Use the “Font” property to define font family, size, and style.
- Apply Colors: Use the “BackgroundColor” and “Color” properties to apply colors to report items.
Borders and Padding
- Define Borders: Use the “Border” property to set

Certainly! Let’s continue our detailed exploration of designing paginated reports in SQL Server Reporting Services (SSRS), focusing on advanced features, best practices, and deployment strategies.
10. Advanced Report Features
10.1 Subreports
Subreports allow you to embed one report within another, enabling complex layouts and data relationships.
Steps to Add a Subreport:
- Insert Subreport: In the Report Builder, go to the “Insert” tab and select “Subreport.”
- Set Subreport Properties: Right-click the subreport placeholder and choose “Subreport Properties.”
- Choose Report: In the “Subreport” tab, click “Browse” to select the report you want to embed.
- Pass Parameters: In the “Parameters” tab, map parameters from the main report to those in the subreport.
Use Cases:
- Displaying detailed information on demand.(Enterprise DNA Blog)
- Including related data from different sources.
- Creating reusable report components.
10.2 Expressions
Expressions in SSRS are used to dynamically set values for properties like visibility, formatting, and data.
Common Expression Examples:
- Conditional Formatting: Change background color based on value.
=IIf(Fields!SalesAmount.Value > 1000, "Green", "Red")
- Concatenating Text: Combine first and last names.(ax.docentric.com)
=Fields!FirstName.Value & " " & Fields!LastName.Value
- Date Formatting: Format date fields.(janbasktraining.com)
=Format(Fields!OrderDate.Value, "MM/dd/yyyy")
Best Practices:
- Use expressions for dynamic content.(Microsoft Learn)
- Keep expressions simple for better performance.
- Test expressions thoroughly to ensure accuracy.(Pluralsight)
10.3 Drillthrough Reports
Drillthrough reports allow users to click on a report item to view detailed information in another report.
Steps to Implement Drillthrough:
- Create Target Report: Design the report that will display detailed information.
- Add Action to Source Report: In the source report, right-click the item (e.g., a textbox) and select “Text Box Properties.”
- Set Action: In the “Action” tab, select “Go to report” and choose the target report.
- Pass Parameters: Map parameters from the source report to the target report.
Use Cases:
- Providing detailed views of summarized data.
- Allowing users to explore data hierarchies.
- Enabling in-depth analysis without cluttering the main report.
10.4 Drilldown Toggles
Drilldown toggles allow users to expand or collapse data groups within a report, enhancing interactivity.
Steps to Implement Drilldown Toggles:
- Group Data: Ensure your data is grouped appropriately in a table or matrix.
- Set Visibility: Right-click the row or column group and select “Row Visibility” or “Column Visibility.”
- Define Toggle: Set the visibility to “Show or hide based on an expression” and specify the toggle item.
Use Cases:
- Allowing users to focus on specific data subsets.
- Reducing report length by collapsing less important data.(Quant Insights Network)
- Enhancing user experience with interactive features.
11. Best Practices for Report Design
11.1 Consistent Layout and Formatting
- Uniform Styles: Use consistent fonts, colors, and styles throughout the report.
- Alignment: Ensure proper alignment of text and data for readability.
- Spacing: Maintain adequate spacing between elements to avoid clutter.
11.2 Data Presentation
- Summarization: Use grouping and aggregation to present summarized data.
- Charts and Graphs: Incorporate visual elements like charts to represent trends and comparisons.
- Conditional Formatting: Highlight key data points using conditional formatting.
11.3 Performance Optimization
- Efficient Queries: Write optimized SQL queries to reduce data retrieval time.
- Data Caching: Use caching to store frequently accessed data.
- Minimal Data: Retrieve only the necessary data to improve performance.
11.4 User Experience
- Interactive Elements: Incorporate features like drillthrough and drilldown for interactivity.
- Clear Navigation: Provide intuitive navigation for users to explore the report.
- Responsive Design: Ensure the report is accessible on various devices.
12. Deployment and Management
12.1 Deploying Reports
- Save Report: In Report Builder, save the report to a shared location.(Microsoft Learn)
- Upload to Report Server: Use the Report Manager to upload the report to the SSRS server.
- Set Permissions: Configure security settings to control user access to the report.
12.2 Managing Reports
- **Subscriptions